The Call Stack and Debugging
The Call Stack

-
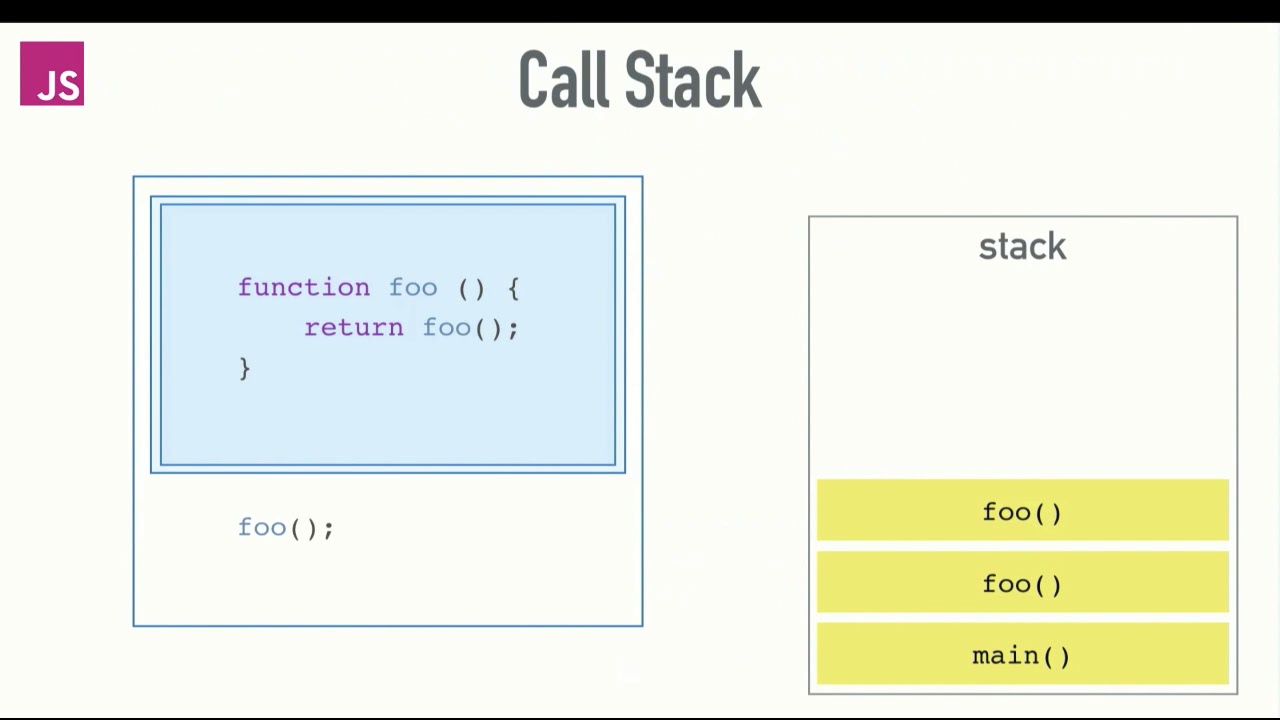
A call stack is a mechanism for an interpreter to keep track of its place in a script that calls multiple functions what function is currently being run and what functions are called from within that function .
- a call stack is a data structure that uses the Last In, First Out (LIFO) principle to temporarily store and manage function invocation (call).
- Last In, First Out (LIFO) principle, it means that the last function that gets pushed into the stack is the first to be pop out, when the function returns.
-
When a script calls a function, the interpreter adds it to the call stack and then starts carrying out the function.
- Any functions that are called by that function are added to the call stack further up, and run where their calls are reached.
- When the current function is finished, the interpreter takes it off the stack and resumes execution where it left off in the last code listing.
-
If the stack takes up more space than it had assigned to it, it results in a “stack overflow” error.
-
In summary, then, we start with an empty Call Stack. Whenever we invoke a function, it is automatically added to the Call Stack. Once the function has executed all of its code, it is automatically removed from the Call Stack. Ultimately, the Stack is empty again.
- Since the call stack is single, function(s) execution, is done, one at a time, from top to bottom. It means the call stack is synchronous.
- When a function is invoked (called), the function, its parameters, and variables are pushed into the call stack to form a stack frame. This stack frame is a memory location in the stack. The memory is cleared when the function returns as it is pop out of the stack.
JavaScript error messages & debugging

Errors

Reference errors
- This is as simple as when you try to use a variable that is not yet declared you get this type os errors.
- when using const and let, they are hoisted like var and function but there is a time between the hoisting and being declared so when you try to access them a reference error occurs, is called Temporal Dead Zone.
Syntax errors
- This occurs when you have something that cannot be parsed in terms of syntax, like when you try to parse an invalid object using JSON.parse.

Range errors
- when you try to manipulate an object with some kind of length and give it an invalid length and this kind of errors will show up.
Type errors
- This types of errors show up when the types (number, string and so on) you are trying to use or access are incompatible, like accessing a property in an undefined type of variable.
Debugging

- The easiest and maybe the most common way its to simply
console.log()the variables you want to check or, by using chrome developer tools, open your page with your JS code (presscmd+oin macOS orCtrl+oin Windows) and choose your file to debug, click the line you wanna debug and refresh your page again (F5). - The breakpoint can also be achieved by putting a debugger statement in your code in the line you want to break.
- Using Node.js with Visual Studio Code you can press the debug tab and add a configuration You can run the debugger by pressing
F5or pressing the green play button.Handling errors
- we usually
trytocatchthe errors so we can gracefully fallback to a default state of our application in case of an error (this fallback can be a 404 page which is normally not that graceful but is better than a page to just stop working).Tools to avoid runtime errors
you can use tools like:
- quokka to evaluate your code as you type.
- eslint to make sure your style guide is consistency and it will grab you an error or two along the way.
- You can check out stuff like TypeScript.